In 2014, I set out to make some changes that would reduce our family’s impact on the environment and – hopefully – result in some financial benefits as well. During the year, we took the following actions:
- Replaced about 60% of the light bulbs in our home with LED bulbs
- Swapped out our 2.5 gallons per minute (gpm) shower heads for 20% more efficient WaterSense fixtures (with a flow rate of 2.0 gpm)
- Drastically reduced our use of the clothes dryer (which we now use only for towels and post-vacation laundry pileups)
- Cleaned all of the filters and coils in our air conditioning and refrigeration equipment
- Changed to green cleaning products that received an “A” rating from the Environmental Working Group (replacing several products that received a grade of “F”)
- Took steps to reduce the number of catalogs and direct mail solicitations received by our household
- Recycled our electronic waste (which included about 20 old cell phones that had been accumulating in random drawers throughout our home)
I can’t quantify all of the financial benefits of having made these changes. We live in an apartment building and don’t have separate metering for water use. And the economic benefit of eliminating catalogs doesn’t accrue to us. Still, I’ve been curious about how some of these changes have affected our utility bill. So I pulled out three years of gas and electric bills to see if there have been any measurable changes.
To establish a baseline and to identify any “outliers,” I reviewed our utility bills over a two year period prior to having started my “Practical Sustainability” campaign. The chart below shows our household’s monthly electric use in kilowatt hours (kWh) over the three year period from 2012 – 2014.
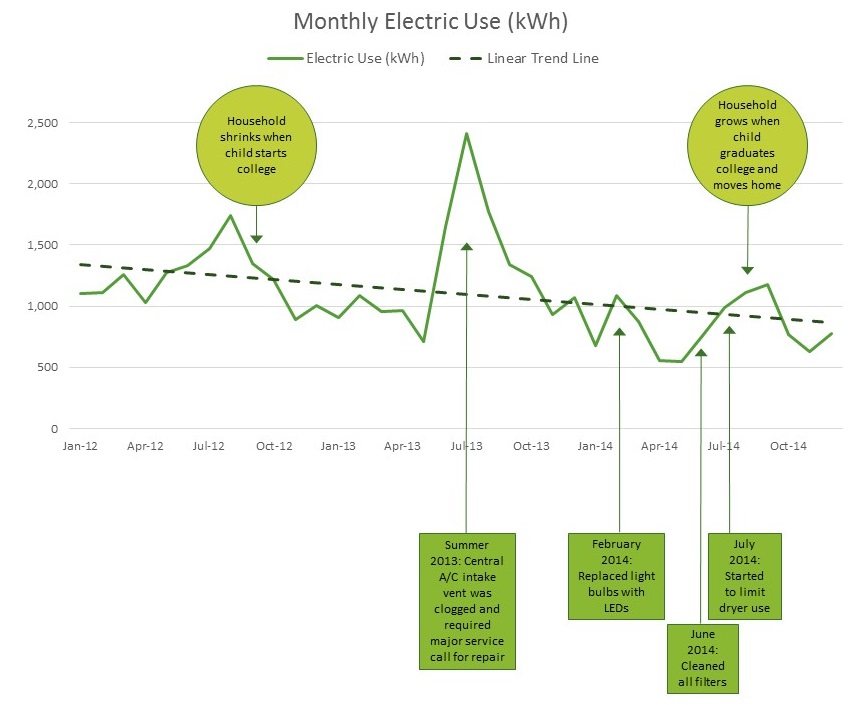
We expected to see some decrease in usage as one of our children moved away to start college in September 2012, and an increase when another one of our children graduated college and moved back home this summer. We also identified a significant efficiency loss (i.e., a spike in usage) in the summer of 2013. Our central air conditioning failed because the exterior air intake had become clogged with dryer lint – which forced the A/C unit to work harder to try to draw air inside. Note: do not locate dryer vents near A/C intakes (we had no choice, as we live in a 100+ year old apartment building)!
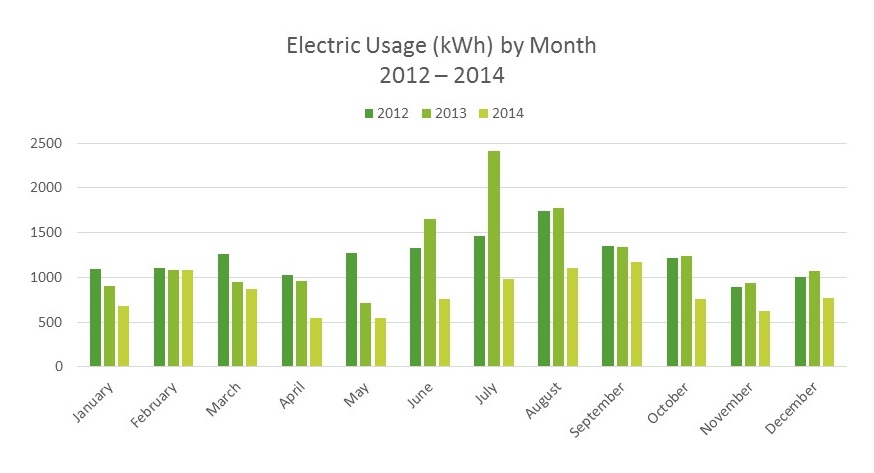
What is important to note is the steady improvement in our electric usage following each of the “Practical Sustainability” actions we implemented in 2014. The chart below shows the same data in another format, which allows for a year-over-year comparison of monthly electrical usage. For every month, our 2014 usage is below – and in some cases significantly below – the same month’s usage in 2012 and 2013, despite the fact that we have more people living at home in 2014 than we did in 2012. For example, in late February 2014 and through March, we changed our light bulbs from incandescent and halogen to LED. Our electric use following those actions declined significantly. Despite the increase in our household’s size in late summer 2014, we have kept our electric usage lower than the prior years' baselines.
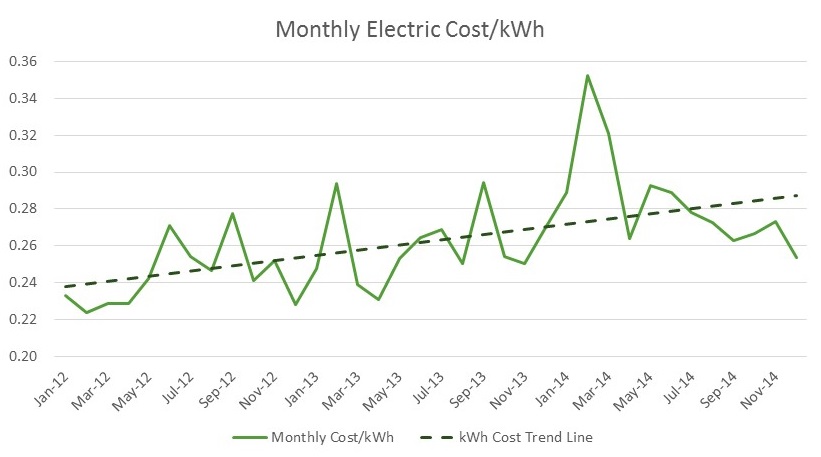
I also evaluated the per kilowatt cost of electricity. We live in New York, where the 2013 cost per kilowatt-hour of residential electricity was second only to Hawaii. The chart below shows a steady increase in our unit cost of electricity (I included all taxes and access fees from my electric bill). If we hadn’t made any changes in usage, we would have seen our electric bill increase by 10% simply as a result of climbing utility rates.
But the chart below summarizes the value of the changes we made this year. By decreasing our electricity usage, we lowered our electric bill by over $1,100 in 2014 despite the 10% rate increase. How did we do it? By decreasing our usage by 34% from 2013 to 2014.

We’re happy to have kept $1,100 in our pockets this year. But we don’t want to lose sight of the environmental impact of our actions. By reducing our electricity consumption by over 5,100 kWh, we kept nearly 4 tons of carbon dioxide out of the environment, according to the US EPA’s Greenhouse Gas Equivalencies Calculator. And that’s equivalent to the annual greenhouse gas emissions of 8,375 miles driven by an average passenger vehicle or 1.3 tons of waste sent to the landfill.
Keep an eye out for more Practical Sustainability columns on SunsetGreenHome.com this year. For this month’s column, we’re getting ready to replace several 13-year-old bath fans. Bath ventilation technology has come a long way in the past decade, and I am certain we’ll see another drop in our electric bill…
Now that’s Practical Sustainability!